
Analytics
The Simple Marketing Reporting Dashboard Every Business Owner Needs
Learn how to build a clean marketing dashboard focused on commercial metrics rather than vanity data to make better business decisions.
17 November 2026 · 6 min read · ENO-AD
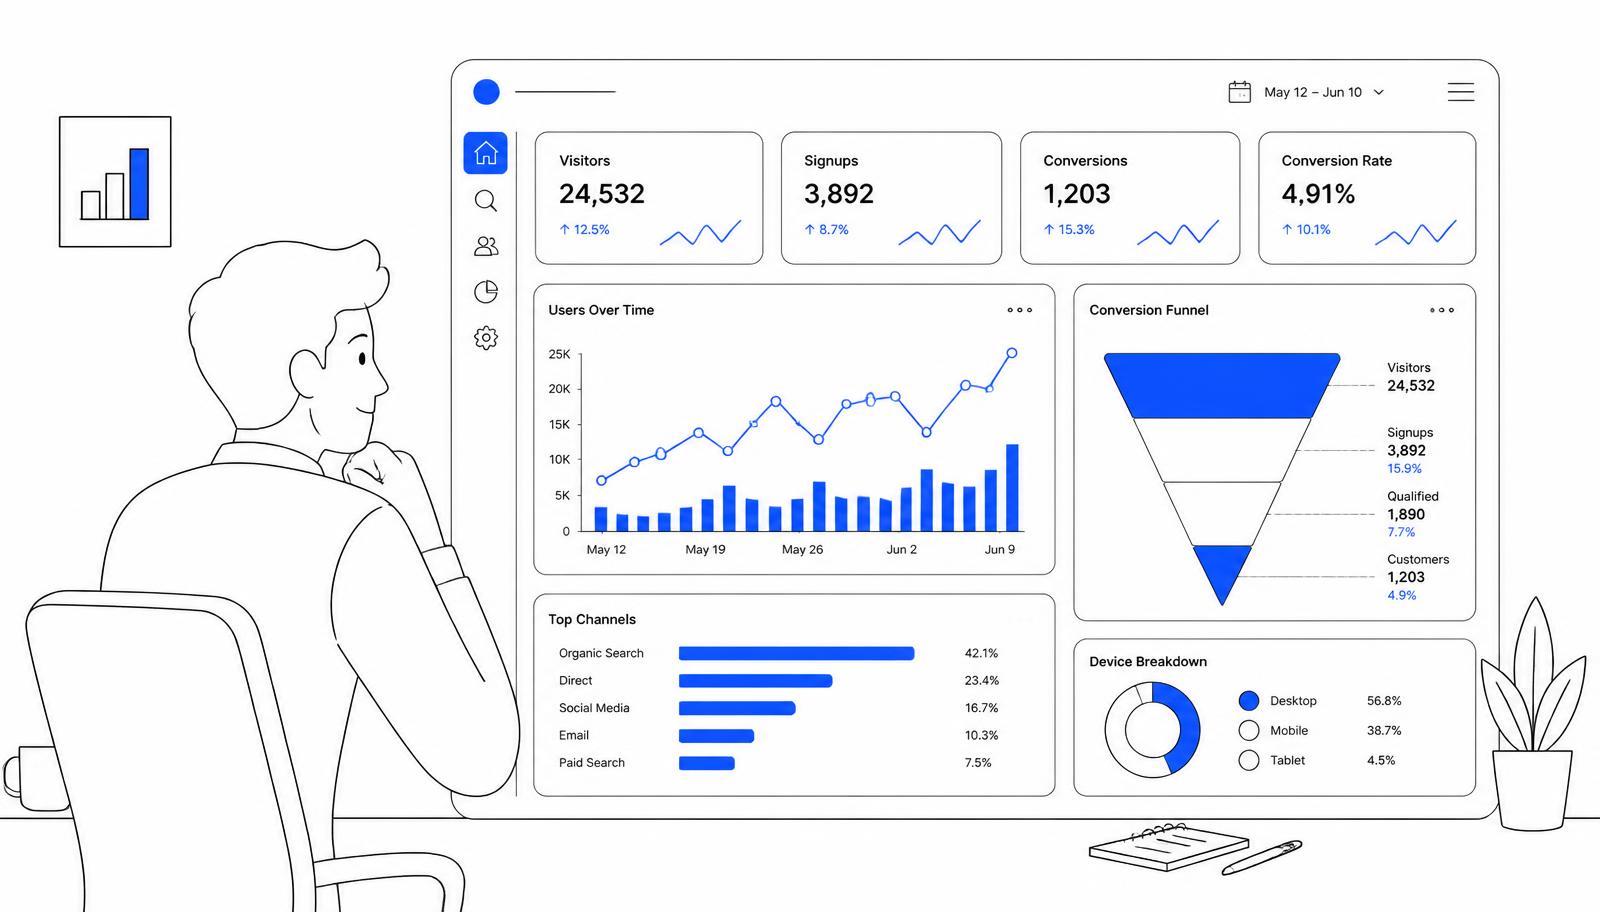
Most business owners receive monthly marketing reports that run twenty pages deep, packed with graphs showing impressions, reach, and click-through rates. Yet after reading them, the central question remains unanswered: is our marketing actually making money?
Data overload often masks a lack of strategic direction. When every metric is highlighted, no metric matters. A good reporting dashboard should fit on a single screen, update automatically, and show precisely how marketing investment converts into commercial growth.
Why Most Marketing Dashboards Fail
Traditional agency reports are frequently designed to justify agency fees rather than inform business decisions. They focus heavily on upper-funnel metrics because those numbers are large and consistently move upwards when budget is applied.
However, high traffic volume means very little if none of those visitors convert into paying clients. To run a business effectively, you need a reporting tool that bridges the gap between creative execution and financial reality.
A functional dashboard separates vanity metrics from performance metrics. Vanity metrics tell you people noticed you; performance metrics tell you people bought from you.
The Four Quadrants of an Actionable Dashboard
To keep your reporting concise, structure your dashboard into four clear quadrants. Each section answers one key question about your commercial performance.
1. Acquisition: Where Are the Right People Coming From?
Do not list every traffic source. Group your data to show quality over raw numbers.
- Qualified Session Count: Exclude non-target regions and internal traffic.
- Traffic by Primary Channel: Break down sessions by Organic Search, Paid Search, Paid Social, Direct, and Referral.
- New vs. Returning Visitors: Track whether you are building brand awareness or retaining existing interest.
2. Conversion: Are Visitors Taking Meaningful Action?
Traffic without conversion is an expense, not an investment. This quadrant tracks visitor commitment.
- Total Conversions: Group these into micro-conversions (newsletter sign-ups, brochure downloads) and macro-conversions (demo requests, contact forms, purchases).
- Conversion Rate by Channel: Identifies which traffic sources generate actual prospects, not just casual browsers.
- Form Completion Rate: Tracks friction points on key landing pages.
3. Efficiency: What Does It Cost to Generate Growth?
This section provides financial context to your marketing output. Without cost metrics, high lead volumes can hide poor profitability.
- Cost Per Lead (CPL): Total channel spend divided by total qualified leads generated from that channel.
- Customer Acquisition Cost (CAC): The total cost (ad spend plus agency fees) required to secure a paying client.
- Return on Ad Spend (ROAS): For e-commerce businesses, revenue generated per euro spent on media buying.
4. Commercial Impact: What Is Marketing Adding to the Bottom Line?
This is the section most standard reports leave out because it requires connecting analytics tools to your CRM or ERP system.
- Pipeline Value Generated: The total potential value of sales opportunities created by marketing leads.
- Closed Revenue from Marketing: Actual revenue won from leads generated in current or recent campaigns.
- Average Order Value (AOV) or Deal Size: Tracks whether your marketing is attracting higher-value clients over time.
Choosing the Right Tool and Structure
You do not need an expensive enterprise business intelligence suite to achieve clarity. For most small to mid-sized European businesses, standard tools configured correctly will suffice.
Looker Studio remains a practical, cost-effective choice for consolidating data from Google Analytics 4, paid ad platforms, and spreadsheets. For companies heavily integrated into Microsoft environments, Power BI offers deeper integration with enterprise databases. Privacy-conscious businesses operating in Europe might prefer lightweight platforms like Plausible or Fathom for website telemetry combined with simple CRM reports.
Regardless of the software, enforce a strict single-page visual layout. Place your high-level commercial figures at the top left, followed by acquisition and conversion channels in the middle, and efficiency metrics at the bottom.
How to Request This Dashboard This Week
If your current reporting consists of static PDFs sent once a month, take these four practical steps to change your setup.
Step 1: Audit Your Current Metrics
Review your last three monthly reports. Circle every metric that directly influenced a hiring, budget, or strategic decision. Cross out the rest.
Step 2: Connect Your CRM to Your Analytics
Instruct your internal team or agency partner to map lead forms directly into your CRM system. Ensure lead source attributes are correctly passed along so revenue can be attributed accurately to specific marketing channels.
Step 3: Establish a Single Source of Truth
Insist on a dynamic, live dashboard link rather than exported slides. Require that data updates automatically at least once every 24 hours.
Step 4: Set Up a Monthly Review Cadence
Use the dashboard to drive a 30-minute monthly alignment meeting. Focus discussion strictly on underperforming channels and budget reallocation, rather than reviewing individual campaign creatives.
Work with ENO-AD
We build clear, data-driven marketing systems and custom reporting dashboards for growing companies across Europe. Our team connects your analytics directly to your commercial outcomes so you always know where your investment goes.
Email info@eno-ad.com and we will come back to you with a clear plan.
ENO-AD
We offer this as a service.
Strategy, branding, digital marketing, SEO, web and software — built and run by one team. Tell us what you want to grow and we will come back with a clear plan.
Keep reading
SEO
Local SEO for Multi-Location Businesses: A Scalable Strategy
Managing SEO across multiple branch locations requires structure. Here is how to scale local rankings without duplicating content or cluttering search data.
ReadBranding
Brand-first marketing: why identity drives performance
Performance marketing gets cheaper when your brand is clear. Here is how identity, design and advertising work together.
ReadSEO
SEO that still works for small businesses
Search has changed, but the fundamentals still bring customers. A practical, no-nonsense checklist for business owners.
Read